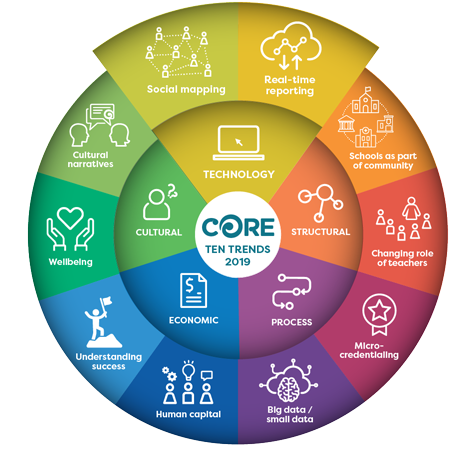
Social mapping
What's this all about?
This trend involves the ways in which technology can enable re-discovery and preservation of the connections we have with ‘our place’. It is about preserving the notion of place as an important part of identity, including how we understand our past and how we face the future.
Social mapping also includes the emerging practices of using big data to bring together multiple views of communities to reveal areas of particular need or opportunity. This includes the community of a school/kura, and the range of factors that may be working for or against the learning and wellbeing of students/ākonga.
The world of Geographic Information Systems (GIS) illustrates this well. When Google Earth was created in 2001, we were introduced to an environment where we could gain views of our world we’d previously accessed through still images in books. It allowed us to build different connections with parts of the planet we inhabit. Just a few years later, in 2005, Google Maps was released, allowing us to navigate between geographical points in ways not previously imagined. Over time more and more detail has been added to what we see on these maps, adding a richness to our understanding of ‘our place’ to the point now where these Google Earth and Google Maps are merged to provide different kinds of views and the information embedded in them.
The key thing here is not the maps that are created, but the seemingly limitless ways in which data about people, places, events, and features may be aggregated and represented as maps to provide views of our environment and communities that we’ve previously not imagined. This can be as true of a geographic map that shows us where the roadworks are at any moment in time as it is of a ‘map’ of our school or classroom, that shows how progress is being made towards learning goals, and what may be inhibiting or accelerating this.
Bringing together large amounts of high quality, geospatial information is one thing, but how might we also integrate the lived experience of people on the ground, what they care about and know to be happening minute by minute?
Social mapping is about how we can bridge the gap between “official” knowledge and local knowledge in ways that make data more authentic and meaningful, valid and reliable, by creating mechanisms for those on the ground to feed into the data gathering process and have their voices, and their perspectives heard and recognised. It involves real-time, two-way communication with everyday people so they can participate in design solutions that meet everyday needs. Used in this way, social mapping provides a means to lift up the power of local and contextualised knowledge.
What's driving this change?
The term social mapping has been deliberately used for this trend to highlight the importance of how the use of technologies to create these ‘maps’ is impacting society, our sense of connection as communities, and our sense of self and wellbeing.
Turning big data into stories, represented as ‘maps’ that allow for various views and interpretations, is a key aspect of this trend, as we try to humanise global issues and challenges. Social mapping is making visible what has been invisible for a very long time (i.e the cultural and indigenous landscapes). It helps us understand histories and our sense of connection with them, and provides perspectives on the future.
The technologies that allow us to combine data gathered from satellites orbiting Earth and sensors in a wide range of locations on Earth, together with the data that is generated in real time by the activities and inputs of humans, allow us to see patterns and trends that would previously have taken very long periods of time to ‘stitch together’.
What examples of this can I see?
- Google and GIS giants such as Esri and QGIS provide a voice for indigenous peoples in relation to all areas of society including education.
- Place-based education (PBE) immerses students in local heritage, cultures, landscapes, opportunities, and experiences, using these as a foundation for the study of Māori histories, Te Reo Māori, mathematics, social studies, science, and other learning areas. PBE emphasises learning through participation in service projects for the local school and/or community. Social mapping is being used here as a way of helping to restore the place of Māori as tangata whenua.
- Map data analyses is helping people make better decisions and it is helping to provide solutions for everyday problems. For example Streetwyze is a project that enables citizens to navigate their neighborhood and discover hidden gems with real time help from the community (see also the Streetwyze Toolkit).
- Putting these tools into the hands of all people especially our young people, enables the future innovators, change makers and leaders - as illustrated by Antwi Akom in his TED talk on Innovation out of poverty and in this talk about How community-driven technology and social innovation can transform how we live in the 21st century.
How might we respond?
Some questions to help you think about the next steps here include:
- How might you have more inclusive engagement processes in your local community? What might this look like on a wider scale, regionally or nationally?
- How might the use of social mapping contribute to your development of a localised curriculum?
- How can you use data to make more effective, community-informed decisions? What mechanisms or processes for gathering and representing this data could you make use of?
- What might the social map of your classroom or school look like if you could create it? What patterns or activities would you be interested in finding out about if such a map was available?
- What links would you include to data from the wider community (e.g. health, welfare etc.) that could add a richness to the decisions you make about student learning?
-
Links
ESRI (Environmental Systems Research Institute)
ESRI build mapping and spatial analytics software to enhance learning in schools.
QGIS (geographic information system)
A free and open-source cross-platform which allows you to create, edit, visualise, analyse and publish geospatial information.
Place-based education | Wikipedia
An innovative app that helps make neighbourhoods better by capturing community voices on any device of what’s working, not working, and needs to be improved.